Introduction

The educational marketplace is filled with products promoting learning dashboards […]. However, the failure to transition from exciting concept demonstrators to embedded practical tools has long dogged educational technology.
Overview
Over the last two decades, technology has been transforming ways in which teaching and learning are delivered to millions of learners around the globe ( Technavio, 2016 ) for both formal and non-formal education and training. Many stakeholders, policy makers, and researchers advocate education technology to improve experiences and outcomes ( Siemens & Long, 2011 ; Chasteen, Perkins, Beale, Pollock, & Wieman, 2011 ; Ferguson, 2012 ). Teachers are, however, the front line end users, who strive to orchestrate technology needs and uses for both inside ( Vermette, McGrenere, Birge, Kelly, & Chilana, 2019 ) and outside ( Hillman, Hillman, Neustaedter, & Pang, 2019 ) classrooms, as well as to harness data to improve teaching and learning ( Campaign, 2018 ).
In face-to-face learning environments, teachers are, more or less, skilled to grasp the classroom’s climate. They frequently observe the status of their living classroom. They can assess learners’ participation and involvement with the learning activities. They can build an awareness of contingencies taking place at individual and group levels. They can engage in formative interventions. They (re)scaffold, (re)instruct, (re)explain parts and aspects of the materials gearing lessons to successfully attain the learning objectives ( Hattie, 2012, p. 81 ).
In online learning, the vital cues of co-located human interactions, including facial expressions, direct contact, dialog with and feedback from learners, among others, are to a large extent lacking. It can be hard for teachers to build a strong emotional, social, and instructional awareness of learners’ online learning ( Jennings & Greenberg, 2009 ). Additionally, learners develop multifaceted behaviors online, including different learning styles, acquisition, progression, pathways, pacing ( Onah, Sinclair, & Boyatt, 2014 ; Lee & Choi, 2010 ). Coupled with the challenges of articulating both remote and co-located learning activities ( Vermette, McGrenere, Birge, Kelly, & Chilana, 2019 ; Hillman, Hillman, Neustaedter, & Pang, 2019 ), it can be hard for teachers to acquire fine-grained knowledge about learners’ interactions with the online learning materials.
Education technology can yield large streams of information on a daily basis, which can provide valuable insights into learners’ behaviors, processes, progress, and skills ( Siemens, 2013 ; Siemens & Baker, 2012 ). Analyzing learning traces to inform day-to-day practices is, however, both a complex and a laborious process ( Baker & Inventado, 2014 ). Teachers come up against barriers for using learning data in their schools. They lack data, visual, and analytical literacy training to analyze, make use, and sense of learning data ( Barbara Wasson, 2015 ). They also lack formal time-slots for leveraging data-informed practices ( Campaign, 2018 ; Sandford, Ulicsak, Facer, & Rudd, 2006 ). There is a growing need for tools that translate learning data into actionable insights for teachers. Information dashboards can fill this gap.
Dashboards are now commonplace in society ( Few, 2004 ; Sarikaya, Correll, Bartram, Tory, & Fisher, 2018 ). They capitalize on our familiarity and experiences in using different information-driven technologies for everyday use: phones, watches, monitors, to name but a few. They present formative insights in a way that facilitates at-a-glance readings. They can shape presentations to fit a wide range of audiences. For teachers and learners alike, dashboards seem promising tools to support a variety of practices on a regular basis, such as monitoring learners ( Holstein, McLaren, & Aleven, 2018 ), supporting learners with lesser abilities ( Molenaar & Campen, 2017 ), providing personalized support to learners in a timely fashion ( Aslan et al., 2019 ), and providing feedback to learners ( Martinez-Maldonado, Clayphan, Yacef, & Kay, 2015 ).
Recent research, however, underlines the lack of longitudinal research examining the design, use, and impact of dashboards on teachers’ practices in “real-world” settings ( Rodriguez-Triana et al., 2016 ; Schwendimann et al., 2017 ; Bodily et al., 2018 ). From a design perspective, Shum et al., argue for a growing need for design-based research centered around needs of teachers and learners in-situ to best serve pedagogical practices through dashboards (). Verbert et al., argue the need for leveraging authentic and “richer set of relevant data” sources in education dashboards ( Verbert et al., 2014 ). Schwendimann et al., underline the need for examining dedicated designs that go beyond simple logs-driven summarization metrics in dashboards ( Schwendimann et al., 2017 ). From an empirical perspective, several reviews of more than 150 dashboards underline the need for longitudinal field studies to better understand how teachers appropriate, leverage, and shape their pedagogical practices around dashboards in the long run ( Verbert et al., 2014 ; Schwendimann et al., 2017 ; Bodily et al., 2018 ). From a methodological perspective, much work on teachers’ dashboards remains somewhat disjoint. @Buckingham2019HCLA underline the need for macro-conceptual implications covering the design space and accounting for the interactions between underlying users and stakeholders. Ferguson highlights the importance of triangulating the social, pedagogical, and technical ramifications in the design and use of learning analytical technologies ( Ferguson, 2012 ).
This dissertation further examines teachers’ dashboard design and use in-the-wild. Specifically, it provides empirical findings from two design and field studies on:
- Teachers’ routines surrounding dashboards. We examine the benefits for teachers from using dashboards to improve learning experiences and outcomes of learners.
- Design and use implications of the social, pedagogical, and technical dimensions of dashboards. These implications can guide information-driven classroom technology and pedagogy.
Thesis Statement
The use of learning technology brings forth both opportunities and challenges. Such technologies often add more features, and tend not to consider teachers’ practices as much. From the learners’ perspective, they are often designed around “do your best”. Teachers’ dashboards can bridge the gap between learning technology and pedagogy. We argue that this research draws social, pedagogical, and technical implications. On the one hand, to understand the social factors, we need a critical inquiry into the pedagogical practices and the technical challenges underpinned by teachers’ dashboards. On the other hand, to properly design such technologies, we need a profound understanding and consideration of the social interactions of users.
Research Approach
We conducted this thesis in the context of two commercial learning platforms. Both platforms specialize in online language learning. is a video-conferencing platform dedicated to improving oral communication skills in a foreign language, English, French, and Spanish. Teachers use to deliver virtual live classes to learners. is a web-based platform dedicated to learning French vocabulary, grammar, and spelling concepts. Teachers use to level up the writing skills of learners. Both platforms are used by public/private schools, as well as professional teachers. With we examined teachers’ dashboards in a fully remote learning setting. On the other hand, with we examined teachers’ dashboards in a blended setting where teachers articulate both face-to-face and remote online learning. Together, both platforms provided us with interesting contexts for examining the design and use of teachers’ dashboards in real-world learning settings.
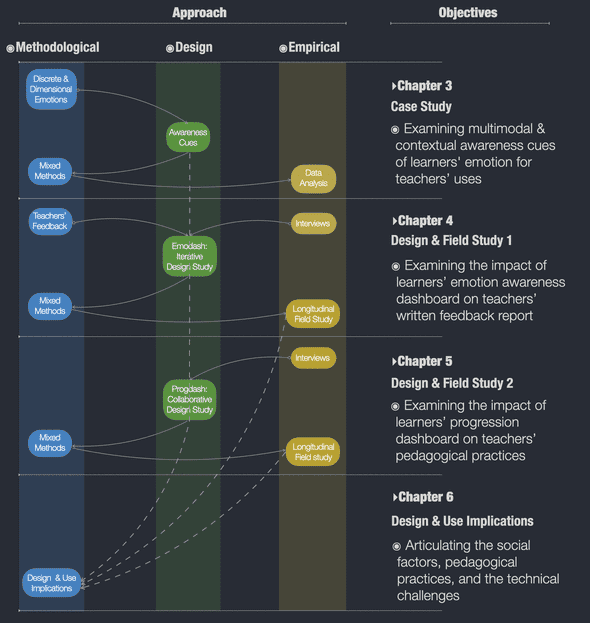 Figure 1: The methodological, design, and empirical research approach and
objectives of this
thesis.
Figure 1: The methodological, design, and empirical research approach and
objectives of this
thesis.
We took an iterative mixed research approach and built upon research from different fields, including social science, human-computer interaction, human-centered design, information visualization, learning analytics. Figure 1 illustrates the methodological, design, and empirical approach of this thesis.
In the context of , teachers face one main challenge: lack of emotional awareness in online learning, which is due to remote and technology-mediated interactions. We built upon emotion models to seamlessly incorporate, in the platform, cues to foster teachers’ awareness of learners’ emotions. We then iteratively designed an interactive dashboard, to support teachers’ feedback reports, written to learners after each live learning session.
In the context , teachers face one main challenge: lack of fine-grained feedback about learners’ interactions with online learning materials to inform pedagogical interventions. We conducted a design study ( Sedlmair, Meyer, & Munzner, 2012 ) with teachers. We collaboratively designed to assist teachers in bridging between learners’ online learning and data-informed pedagogical practices.
We built upon the results of our studies of and to drive the social factors, pedagogical practices, and technical challenges intersecting and interacting in the design and use of teachers’ dashboards ( Shum, Ferguson, & Martinez-Maldonado, 2019 ; Ferguson, 2012 ).
We hope to contribute from three perspectives:
First, from a design perspective, we designed, implemented, and deployed two fully functioning teachers-centered dashboards in real-world settings, to study teachers’ dashboards in-situ:
- Emodash, a dashboard designed based on interviews with five teachers and one learner and refined through an iterative design process, to facilitate teachers’ retrospective awareness of learners’ emotions, and support teachers’ writing of reinforcement feedback reports to learners after video-conferencing language learning sessions.
- Progdash, a dashboard designed based on interviews with seven teachers and refined through collaborative design prototypes, to bridge between learners’ use of an online grammar learning platform and teachers’ data-informed pedagogical practices.
Second, from an empirical perspective, we designed and conducted qualitative and quantitative analyses to distill empirical evidence to both inform the design and assess the impact of our built artifacts with respect to teachers’ needs and practices:
- We conducted several informal discussions with designers of two online language learning platforms to understand the pedagogical challenges of teachers when using such platforms, as well as their inner working.
- We conducted several formal interviews with teachers to understand their needs, challenges, and pedagogical practices through which they aim to influence and reinforce learners’ learning.
- We designed and conducted two of the first design studies and in-the-wild longitudinal field studies, lasting two and three months, respectively, to study how 34 teachers from both studies, make use and sense of dashboards to inform their pedagogical practices.
- We conducted several formal post-interviews with teachers to evaluate and report on the usefulness, effectiveness, and impact of our artifacts on teachers’ everyday practices.
- We conducted a qualitative and quantitative exploratory analysis comparing learners’ inferred emotions from two different modalities, namely audio and video streams.
- We conducted a qualitative and quantitative analysis comparing teachers’ written feedback reports with and without ; and also to articulate teachers’ pedagogical practices when using .
And finally, from a methodological perspective, we built upon a broad spectrum of research theories, methods, and studies to both inform the design and assess the use of teachers’ dashboards in context:
- We built upon emotion recognition theories and studies from psychology ( Ekman & Friesen, 1976 ; Barrett & Russell, 1998 ) to ground, capture, quantify, and integrate cues ( D’Mello, 2017 ) to foster teachers’ awareness of learners’ emotions in online learning environments.
- We proposed a method to unify discrete and dimensional models of emotions to make it easier to combine and use them in a multimodal fashion ( Ez-zaouia & Lavoué, 2017 ).
- We conducted an exploratory analysis of more than 7 hours’ recordings to compare learners’ inferred emotions from two different modalities: audio and video streams, when using video-conferencing learning sessions.
- We conducted an exploratory analysis of more than 10 hours’ screen recordings to examine teachers’ experience when writing feedback reports with the use of .
- We conducted a qualitative thematic analysis ( Braun & Clarke, 2006 ) of interviews to assess the impact of both studies of and .
- We conducted a quantitative non-parametric factorial analysis ( Wobbrock & Kay, 2016 ) to compare teachers’ written feedback reports with and without the use of .
- We proposed design implications that triangulate the social, pedagogical, and technical dimensions underpinned by teachers’ dashboards.
Thesis Outline
In Chapter 3, we examine multimodal and contextual awareness cues of learners’ emotions for teachers’ uses. We present a case study of learners’ emotional cues. We apply two theoretical models of emotion: discrete and dimensional. We demonstrate this approach in the context of . We propose to infer emotions from the audio and video streams of the live learning session, along with learners’ self-reported emotions. We contextualize emotional cues using teachers’ and learners’ traces on the platform.
In Chapter 4, we examine the impact of learners’ emotions awareness dashboard on teachers’ written feedback reports. We present a design and longitudinal field study of . We designed based on interviews with five teachers. We refined the design through an iterative design process. We evaluated its impact through a two-month field study with five professional teachers and five learners.
In Chapter 5, we examine the impact of learners’ progression dashboard on teachers’ pedagogical practices. We present a design and longitudinal field study of . We designed based on interviews with seven teachers. We collaboratively iterated and refined the design through informal discussions with teachers and designers of the platform. We evaluated its impact through a three-month field study with 29 teachers from middle, high, and vocational schools, and university.
In Chapter 6, we articulate the social factors, the pedagogical practices, and the technical challenges of the design and use of teachers’ dashboards. We engaged with these three dimensions, to examine the opportunities and challenges that we may face in the development of teachers’ dashboards. Together, these dimensions serve as a conceptual umbrella for the design of information-driven technologies and macro-implications for dashboards fitting teachers’ and learners’ everyday situations and contexts.
References
- Aslan, S., Alyuz, N., Tanriover, C., Mete, S. E., Okur, E., DMello, S. K., & Esme, A. A. (2019). Investigating the Impact of a Real-Time, Multimodal Student Engagement Analytics Technology in Authentic Classrooms. In Proceedings of the 2019 CHI Conference on Human Factors in Computing Systems - CHI 19. ACM Press. https://doi.org/10.1145/3290605.3300534↩
- Baker, R. S., & Inventado, P. S. (2014). Educational Data Mining and Learning Analytics. In Learning Analytics (pp. 61–75). Springer New York. https://doi.org/10.1007/978-1-4614-3305-7_4↩
- Barbara Wasson, C. H. (2015). Data Literacy and Use for Teaching (pp. 56–40). Taylor &Francis. https://doi.org/10.4324/9781315777979↩
- Barrett, L. F., & Russell, J. A. (1998). Independence and Bipolarity in the Structure of Current Affect. Journal of Personality and Social Psychology, 74(4), 967–984. https://doi.org/10.1037/0022-3514.74.4.967↩
- Bodily, R., Kay, J., Aleven, V., Jivet, I., Davis, D., Xhakaj, F., & Verbert, K. (2018). Open Learner Models and Learning Analytics Dashboards: A Systematic Review. In Proceedings of the 8th International Conference on Learning Analytics and Knowledge (pp. 41–50). Sydney, New South Wales, Australia: ACM. https://doi.org/10.1145/3170358.3170409↩
- Braun, V., & Clarke, V. (2006). Using Thematic Analysis in Psychology. Qualitative Research in Psychology, 3, 77–101. https://doi.org/10.1191/1478088706qp063oa↩
- Campaign, D. Q. (2018). What Parents and Teachers Think about Education Data.↩
- Chasteen, S., Perkins, K., Beale, P., Pollock, S., & Wieman, C. (2011). A Thoughtful Approach to Instruction: Course Transformation for the Rest of Us.↩
- D’Mello, S. K. (2017). Emotional Learning Analytics. In Handbook of Learning Analytics (pp. 115–127). Society for Learning Analytics Research (SoLAR). https://doi.org/10.18608/hla17.010↩
- Ekman, P., & Friesen, W. V. (1976). Measuring Facial Movement. Environmental Psychology and Nonverbal Behavior, 1(1), 56–75.↩
- Ez-zaouia, M., & Lavoué, E. (2017). EMODA: A Tutor Oriented Multimodal and Contextual Emotional Dashboard. In Proceedings of the Seventh International Learning Analytics &Knowledge Conference (pp. 429–438). Vancouver, British Columbia, Canada: ACM. https://doi.org/10.1145/3027385.3027434↩
- Ferguson, R. (2012). Learning Analytics: Drivers, Developments and Challenges. International Journal of Technology Enhanced Learning, 4, 304–317. https://doi.org/10.1504/IJTEL.2012.051816↩
- Few, S. (2004). Dashboard Confusion.↩
- Hattie, J. (2012). Visible Learning for Teachers. Routledge. https://doi.org/10.4324/9780203181522↩
- Hillman, S., Hillman, A., Neustaedter, C., & Pang, C. (2019). “I Have a Life”: Teacher Communication &Management Outside the Classroom. In Extended Abstracts of the 2019 CHI Conference on Human Factors in Computing Systems (p. LBW2410:1-LBW2410:6). Glasgow, Scotland Uk: ACM. https://doi.org/10.1145/3290607.3312943↩
- Holstein, K., McLaren, B. M., & Aleven, V. (2018). Student Learning Benefits of a Mixed-Reality Teacher Awareness Tool in AI-Enhanced Classrooms. In Lecture Notes in Computer Science (pp. 154–168). Springer International Publishing. https://doi.org/10.1007/978-3-319-93843-1_12↩
- Jennings, P. A., & Greenberg, M. T. (2009). The prosocial classroom: Teacher social and emotional competence in relation to student and classroom outcomes. Review of Educational Research, 79(1), 491–525.↩
- Lee, Y., & Choi, J. (2010). A Review of Online Course Dropout Research: Implications for Practice and Future Research. Educational Technology Research and Development, 59(5), 593–618. https://doi.org/10.1007/s11423-010-9177-y↩
- Martinez-Maldonado, R., Clayphan, A., Yacef, K., & Kay, J. (2015). MTFeedback: Providing Notifications to Enhance Teacher Awareness of Small Group Work in the Classroom. Learning Technologies, IEEE Transactions On, 8, 187–200. https://doi.org/10.1109/TLT.2014.2365027↩
- Molenaar, I., & Campen, C. K. (2017). Teacher Dashboards in Practice: Usage and Impact. In Data Driven Approaches in Digital Education (pp. 125–138). Springer International Publishing. https://doi.org/10.1007/978-3-319-66610-5_10↩
- Onah, D. F., Sinclair, J., & Boyatt, R. (2014). Dropout Rates of Massive Open Online Courses: Behavioural Patterns. EDULEARN14 Proceedings, 1, 5825–5834.↩
- Rodriguez-Triana, M., Prieto, L., Vozniuk, A., Shirvani Boroujeni, M., Schwendimann, B., Holzer, A., & Gillet, D. (2016). Monitoring, Awareness and Reflection in Blended Technology Enhanced Learning: A Systematic Review. International Journal of Technology Enhanced Learning, 9. https://doi.org/10.1504/IJTEL.2017.10005147↩
- Sandford, R., Ulicsak, M. H., Facer, K., & Rudd, T. (2006). Teaching with Games Using Commercial Off-the-Shelf Computer Games in Formal Education.↩
- Sarikaya, A., Correll, M., Bartram, L., Tory, M., & Fisher, D. (2018). What Do We Talk about When We Talk about Dashboards? IEEE Transactions on Visualization and Computer Graphics, 25(1), 682–692. https://doi.org/10.1109/TVCG.2018.2864903↩
- Schwendimann, B. A., Rodriguez-Triana, M. J., Vozniuk, A., Prieto, L. P., Boroujeni, M. S., Holzer, A., … Dillenbourg, P. (2017). Perceiving Learning at a Glance: A Systematic Literature Review of Learning Dashboard Research. IEEE Transactions on Learning Technologies, 10(1), 30–41. https://doi.org/10.1109/tlt.2016.2599522↩
- Sedlmair, M., Meyer, M., & Munzner, T. (2012). Design Study Methodology: Reflections from the Trenches and the Stacks. IEEE Transactions on Visualization and Computer Graphics, 18(12), 2431–2440. https://doi.org/10.1109/tvcg.2012.213↩
- Shum, S. B., Ferguson, R., & Martinez-Maldonado, R. (2019). Human-Centred Learning Analytics. Journal of Learning Analytics, 6, 1–9. https://doi.org/10.18608/jla.2019.62.1↩
- Siemens, G. (2013). Learning Analytics: The Emergence of a Discipline. American Behavioral Scientist, 57(10), 1380–1400. https://doi.org/10.1177/0002764213498851↩
- Siemens, G., & Baker, R. S. (2012). Learning Analytics and Educational Data Mining. In Proceedings of the 2nd International Conference on Learning Analytics and Knowledge - LAK 12. ACM Press. https://doi.org/10.1145/2330601.2330661↩
- Siemens, G., & Long, P. (2011). Penetrating the Fog: Analytics in Learning and Education. EDUCAUSE Review, 5, 30–32.↩
- Technavio. (2016). Digital Classroom Market Will Grow at an Impressive CAGR of Almost 13%until 2020.↩
- Verbert, K., Govaerts, S., Duval, E., Santos, J. L., Van Assche, F., Parra, G., & Klerkx, J. (2014). Learning Dashboards: An Overview and Future Research Opportunities. Personal and Ubiquitous Computing, 18(6), 1499–1514.↩
- Vermette, L., McGrenere, J., Birge, C., Kelly, A., & Chilana, P. K. (2019). Freedom to Personalize My Digital Classroom: Understanding Teachers’ Practices and Motivations. In Proceedings of the 2019 CHI Conference on Human Factors in Computing Systems (p. 318:1-318:14). Glasgow, Scotland Uk: ACM. https://doi.org/10.1145/3290605.3300548↩
- Wobbrock, J. O., & Kay, M. (2016). Nonparametric Statistics in Human–Computer Interaction. In Human–Computer Interaction Series (pp. 135–170). Springer International Publishing. https://doi.org/10.1007/978-3-319-26633-6_7↩